Triangle Pattern : Meaning, Types & How It Works
- 20th October 2025
- 12:00 AM
- 7 min read
A triangle pattern acts as a technical tool for market analysis and helps traders time the market as prices consolidate. Here, the prices move into a narrow range, indicating a potential breakout. As of May in FY25 alone, about 45.5 lakh traders are trading in the National Securities Exchange (NSE) in India. This shows an increasing trend of Indians participating in trades. If you are into trades, learn about this technical analytical tool.
What Does a Triangle Pattern Mean?
As a trader, when you participate in the stock market, you can resort to technical analysis, like a triangle pattern. There are more than 100 indicators or patterns in the stock market that might assist traders in understanding trading price fluctuations, forecasting, etc.
A triangle chart pattern, as the name suggests, is shaped like a triangle and usually represents a pause or consolidation phase in an ongoing market trend. It often indicates a period of indecision among traders before the next major price movement.
When this pattern begins to form, it appears wide at first but gradually narrows as the market moves sideways. As the trading range tightens, the tip of the triangle takes shape, signalling that the price is preparing for a potential breakout in either direction.
For instance, if a stock rises from INR 100 to INR 150 and then fluctuates between INR 140 and INR 145, it shows the highs and lows converging. This consolidation suggests that traders are waiting for clearer market signals, and the emerging triangle pattern could point toward an upcoming breakout or trend continuation.
Understanding the Working of a Triangle Pattern
Skilled trades across India might potentially generate a profit as high as INR 1 lakh from stock market trades if they strategise properly.
Thus, if you are interested in trades, a triangle chart pattern might be helpful as a form of strategy to increase the potential of making market gains through technical analysis:
- A triangle pattern might be helpful for traders in determining potential price action in the future. As a trader, this might be helpful for you to make an informed trading decision.
- Suppose a stock is moving past INR 145 from a range of INR 140 to INR 145. Here, a trader might decide to buy, anticipating a rally toward INR 160.
- Here, one line forms a boundary where price faces resistance, while the other provides support. Their slopes, either upward or downward, might determine how an asset price compresses.
- Such a scenario typically happens when the buyers and sellers balance out due to price compression. Eventually, pressure might build up, leading to a potential breakout that might be upward or downward, depending on the market forces.
With PL Capital Group – Prabhudas Lilladher, you can start trading by simply completing an e-KYC. Download the PL Capital app, complete the KYC verification and start your trades.
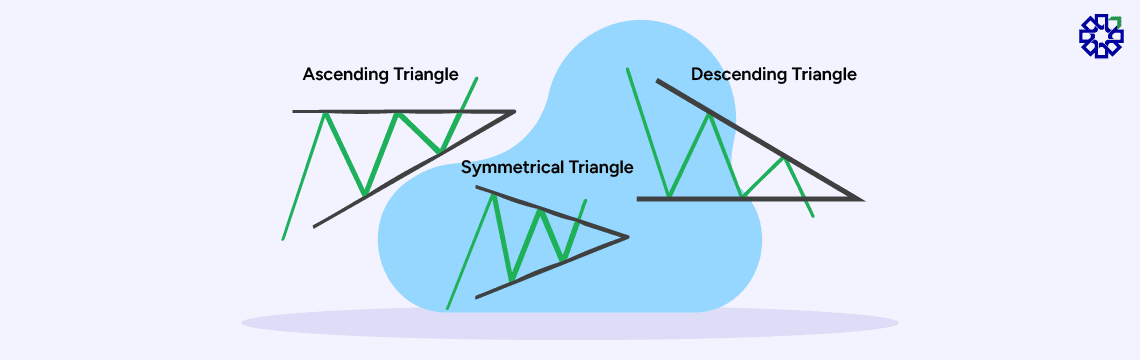
3 Types of Triangle Pattern
-
Ascending Triangle
Also known as the bullish continuation pattern, this triangle chart pattern forms when a certain asset price creates a series of multiple higher lows and faces horizontal resistance:
- When you spot this pattern, it typically means that buyers are gaining strength with the potential of the market to break out upwards. Here, an upward-sloping trendline is created.
- For example, suppose a stock rises steadily from INR 200 to INR 250 along an upward-sloping line, creating higher lows. This shows that buyers are gaining strength.
- The horizontal line shows that the asset prices have hit the same highs multiple times yet failed to break through. Continuing the example, the same stock repeatedly hits INR 260 and retreats to INR 250. This shows a strong resistance.
- Now, if a breakout happens, it generally occurs beyond the level of resistance or the horizontal line. This confirms a potential bullish movement of the market.
-
Descending Triangle Pattern
This is one of the triangle patterns in trading that usually represents a bearish continuation pattern. Here is a clear breakdown of this for a clear understanding:
- This triangle chart pattern typically occurs when a certain stock’s price creates multiple lower highs and looks for support at the horizontal level.
- Such a pattern highlights that the sellers are gaining strength and the market might break down.
- The trendline for the horizontal support shows that buyers intend to hold the price. While the highs represent that sellers are trying consistently to push the price lower.
- Suppose a stock is in a downtrend and forms a descending triangle, repeatedly finding support at INR 800 while making lower highs. Now, if the price falls below INR 800, this confirms a bearish breakout.
-
Symmetrical Triangle
Also known as a continuation pattern, this is the 3rd type of triangle patterns in trading and here is why it forms:
- While trading, you might see this triangle pattern when the price of your chosen stock moves towards a narrowing range and thus creates a symmetrical shape.
- Such a pattern usually occurs when neither the buyer nor the seller has any control over the asset prices. Also, the market might consolidate and break out in any of the directions.
- One of the key characteristics of this type of triangle pattern is that the highs and lows of the stock prices typically converge toward a single point.
- Thus, when this pattern occurs, two trend lines usually meet. If you spot this pattern, you will see that one line connects the lower highs. While another one connects the higher lows. The prices thus usually, but the breakout direction remains uncertain.
A Few Limitations of the Triangle Pattern
Now that you know the types of the triangle pattern, take note of the following disadvantages of it and use it wisely:
- Like every other chart type or technical analysis tool, this pattern also might generate false signals about trades. For example, a stock forming a triangle might appear to break beyond INR 1,500, but instead it reverses and drops back, misleading traders.
- A triangle chart pattern seems to be less effective in short-term trades compared to long-term trades. Therefore, such a pattern might not be that effective if you are a day trader.
Conclusion
A triangle pattern is sort of a technical tool for market analysis that traders usually resort to for price forecasting and making trading decisions. There are three types of such a pattern, where one shows a potential bullish, and another shows a bearish. The rest shows an uncertain market movement.
With PL, you can invest in stocks and start your investment journey using the PL Capital app. Download the app from the Play Store or App Store and start investing!
FAQs on Triangle Pattern
1. What is the rule of the triangle pattern?
The rule for working a triangle pattern is forming a chart by imaging trendlines along the converging lows and highs of the asset prices. It usually reflects market consolidation and often leads to a breakout either upward or downward.
2. What is the best timeframe for triangle patterns?
Many traders might defend that using a triangle pattern is best suited when the market is trending. However, there is no such time frame and using it is completely subjective.
3. What is the most successful chart pattern?
The potentially effective patterns in trading are triangle patterns, the Head and Shoulders pattern, the Cup and Handle pattern, etc.
4. Is the triangle pattern bullish?
Among the 3 types, the ascending triangle typically represents a bullish pattern.


