What is a Rounding Top Pattern in Technical Analysis?
- 19th November 2025
- 6 min read
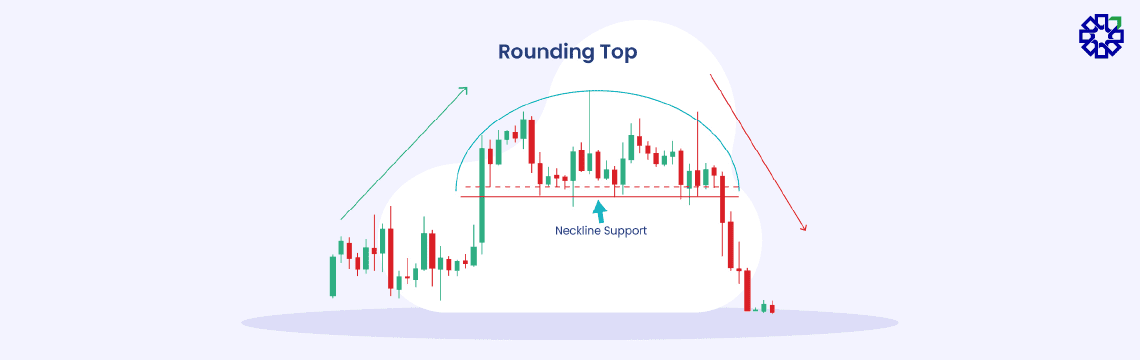
A rounding top pattern helps identify the cycle of rise, peak, and decline of a price in the market. Many of you might miss the slight changes in the market, but those changes can mean a lot. The top of this rounded top pattern is smooth and curved in shape, looking like a round bowl turned upside down.
Read this blog to understand the formation, key features, benefits, and limitations of the rounding top pattern.
What is a Rounded Top Chart Pattern?
A rounding top pattern is an effective price pattern in technical analysis. You can identify this pattern in daily price movements, primarily by its tops. It takes the shape of a downward-sloping curve. At the end of a long upward trend, a rounding top may form, indicating a price reversal in the long-term movement. A rounding top pattern may take shape for many days or even years.
Formation of a Rounded Top Chart Pattern
A rounding top pattern indicates a potential trend reversal in the stock price. This pattern takes shape typically after a long-term uptrend. The pointers below explain its formation:
-
Lower Volume
The trading volume drops when this pattern forms. This means that buyers have become less confident.
-
Curved Shape
After a long price uptrend, the pattern takes the shape of a smooth and rounded curve at the top, just like an upside-down bowl. This indicates that buying interest is weakening and that selling pressure is strengthening.
-
Resistance Point
At the highest point of this curve, there is a resistance point where the price struggles to increase.
-
Confirmation
When the price goes below the support level, this pattern is confirmed and indicates a potential downward trend.
Key Features of The Rounded Top Chart Pattern
The key features of the rounded top chart pattern are mentioned in the pointers below:
- A curved shape where prices go higher, taper off, and then decline
- You can see the support price level at the base of this pattern.
- An inverted volume pattern goes high on both ends but drops in the middle.
How to Identify and Understand an Inside Candle on Price Charts?
An inside candle’s real body is inside the real body of the preceding candle. Traders may use this pattern to refer to a candle whose whole body is engulfed in the previous candle’s body. The first candle is considered the mother candle, and the second candle is considered the inside candle.
You can understand and identify an inside candle on price charts by analysing the pointers below:
-
Position and Size
The inside candle is smaller compared to the mother candle. The opening and closing prices of this inside candle will fall inside the opening and closing price ranges of the mother bar. Based on these values, the inside candle might be surrounded by the upper, lower, or middle part of the mother candle.
-
Number of Candles
An inside candle strategy on price charts considers the mother bar, the inside candles, and the succeeding candle. The mother candle is surrounded by one or more inside candles. The higher number of inside candles indicates a greater indecision in the market.
-
Direction
Inside candles may form in both upward, downward, and sideways directions. You must look into the prevailing trend and market cycle to interpret them for your inside candle strategy. However, an inside candle cannot indicate anything on a standalone basis.
Important Strategies for Trading Inside Bar Candle Patterns
-
Market Entry
You can sell if the price drops below the bottom of the pattern. You need to find the pattern, then draw the support line, and lastly, you can place your sell order below that line.
-
Profit Target
You must set your profit target depending on the pattern’s height. If the pattern moves higher, you can witness the bigger profits.
-
Stop Loss
You may also place a stop loss order above the pattern’s highest point to limit your risk.
Benefits and Limitations of Rounding Top Chart Pattern
| Benefits | Limitations |
| You can see a rounding top pattern in different markets and time frames. | Since a rounding top pattern is large, it can make trading very costly. |
| This pattern is easy to identify. | It may signal a misleading indication when markets are in a consolidation stage. |
| A rounding top pattern indicates an upcoming major downtrend. | Trades depending on this pattern might be longer to complete in a longer time period. |
Final Thought
A rounding top pattern takes the shape of an upside-down curve that shows price movements. This pattern happens at the end of a long upward trend and might indicate a trend reversal in long-term price movements.
If you are interested in intraday trading and candlestick patterns, download the PL Capital Group – Prabhudas Lilladher. While allowing you to open a Demat account for free, PL Capital provides you with deep insights and data-driven analysis on the market.
Frequently Asked Questions on Rounding Top Pattern
1. Is a rounding top pattern bullish or bearish?
A rounding top pattern in price movements typically indicates the end of an uptrend. This means it could be the start of a bearish trend.
2. How to find a rounding top chart pattern?
You can find a rounding top chart pattern if a market is transitioning from a bullish pattern to a bearish one. This shows that uptrend momentum is weakening, and a price reversal might appear soon.
3. How does a rounding top pattern differ from a rounding bottom pattern?
The difference between a rounding top pattern and a rounding bottom pattern lies in their trend. A rounding top pattern is a bearish reversal pattern which indicates the end of a price uptrend. Conversely, a rounding bottom is a bullish reversal pattern that indicates the end of a price downtrend.
4. To what extent can you rely on a rounding top pattern?
The accuracy or reliability of a rounding top pattern is moderate to high, but you cannot solely rely on it. You should also consider using other technical indicators to enhance the pattern’s effectiveness.