
Anupam Rasayan India Ltd
Anupam Rasayan India Ltd Live Price Chart


Performance
| Previous Close | ₹ 1097.7 |
| High | ₹ 1146.9 |
| Volume | 583323 |
| 52W Range | ₹ 1047.9 - ₹ 1415 |
| Open | ₹ 1104.9 |
| Low | ₹ 1083.8 |
| Market Cap | ₹ 13277.74 Cr |
Anupam Rasayan India Ltd Technicals
| 20 Day | ₹ 1,179.244 |
| 50 Day | ₹ 1,208.150 |
| 100 Day | ₹ 1,231.440 |
| 200 Day | ₹ 1,221.301 |
| 20 Day | ₹ 1,181.418 |
| 50 Day | ₹ 1,209.764 |
| 100 Day | ₹ 1,249.194 |
| 200 Day | ₹ 1,270.883 |
Anupam Rasayan India Ltd Fundamentals
| ROCE | 6.408 |
| P/E Ratio | 78.440 |
| P/B Ratio | 3.970 |
| Industry P/E | 3.970 |
| Debt to Equity | 38.956 |
| ROE | 4.989 |
| EPS | 14.380 |
| Dividend Yield | 0.130 |
| Book Value | 284.142 |
| Face Value | 10.000 |
Anupam Rasayan India Ltd Financials
| Particulars | Y202603 | Y202503 | Y202403 | Y202303 | Y202203 |
|---|---|---|---|---|---|
| Total Revenue | 1695.531 | 909.249 | 1154.607 | 1286.309 | 1081.107 |
| Total Expenses | 1524.602 | 828.295 | 980.959 | 1044.074 | 860.926 |
| Profit After Tax | 161.396 | 72.674 | 117.293 | 168.529 | 150.776 |
Anupam Rasayan India Ltd Shareholding Pattern
| Promoter Holdings | 59.073 % |
| FIIs | 7.714 % |
| DIIs | 0.195 % |
| MutualFund | 0.190 % |
| Retail | 23.231 % |
| Others - | 9.598 % |
About Anupam Rasayan India Ltd
Anupam Rasayan India Limited was initially formed as a Partnership Firm as 'Anupam Rasayan' effective from April 01, 1984 at Surat in Gujarat. The Partnership Firm was registered under the Indian Partnership Act, 1932 with Registrar of Firms, Surat in October 22, 1984. Subsequently, the Partnership Firm converted into a joint stock company and was registered as a Public Limited Company under the name 'Anupam Rasayan India Limited' dated September 30, 2003, issued by Registrar of Companies, Gujarat, Dadra and Nagar Haveli. The Company received Certificate of Commencement of Business, issued by Assistant Registrar of Companies, Gujarat, on November 20, 2003. The Company is one of the leading companies engaged in the custom synthesis (CSM) and manufacturing of specialty chemicals in India. The Company has two verticals: Life science-related Specialty Chemicals comprising products related to Agrochemicals, Personal Care, and Pharmaceuticals, Other Specialty Chemicals comprising Specialty Pigment and Dyes, and Polymer Additives. The Company caters to a diverse base of Indian and global customers. The Company operates via its six manufacturing facilities in Gujarat, India, with four facilities located at Sachin, Surat, and two located at Jhagadia, Bharuch with an aggregate installed capacity of about 30,000 MT, as of March 31, 2025. In manufacturing operations, the Company provides large-scale custom synthesis and manufacturing services, offer multi-step synthesis and ...
Similar Stocks
| Atul Ltd Chemicals | ₹ 5,882.50 -40.5 (-0.68%) |
| BASF India Ltd Chemicals | ₹ 3,347.40 +0.6 (+0.02%) |
| Oriental Aromatics Ltd Chemicals | ₹ 518.00 +6 (+1.17%) |
| DIC India Ltd Chemicals | ₹ 603.10 +2.35 (+0.39%) |
| Sudarshan Colorants India Ltd Chemicals | ₹ 350.40 -1.5 (-0.43%) |
| Deepak Fertilisers & Petrochemicals Corp Ltd Chemicals | ₹ 1,392.60 +2.4 (+0.17%) |
FAQs on Anupam Rasayan India Ltd
1. Can I buy Anupam Rasayan India Ltd from PL Capital? ›
2. Does Anupam Rasayan India Ltd pay dividends? ›
3. What is the current share price of Anupam Rasayan India Ltd ? ›
4. What is the 52-week high and low of Anupam Rasayan India Ltd ? ›
5. What is the market capitalisation of Anupam Rasayan India Ltd? ›
6. What is the current P/E ratio of Anupam Rasayan India Ltd? ›
7. What is the current P/B ratio of Anupam Rasayan India Ltd? ›
8. What is the shareholding pattern of Anupam Rasayan India Ltd? ›
9. What is the 1-year return of Anupam Rasayan India Ltd? ›

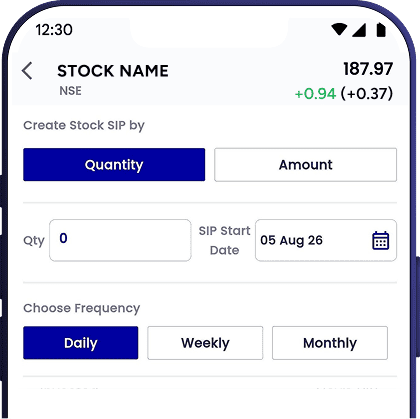
Start SIP in Anupam Rasayan India Ltd
Invest systematically in stocks with the
PL Capital app

Are you a new user? Open your account