
Arfin India Ltd
Arfin India Ltd Live Price Chart


Performance
| Previous Close | ₹ 107.52 |
| High | ₹ 113.83 |
| Volume | 12777249 |
| 52W Range | ₹ 48.55 - ₹ 113.83 |
| Open | ₹ 106.74 |
| Low | ₹ 102.28 |
| Market Cap | ₹ 1739.36 Cr |
Arfin India Ltd Technicals
| 20 Day | ₹ 93.184 |
| 50 Day | ₹ 90.100 |
| 100 Day | ₹ 88.012 |
| 200 Day | ₹ 81.376 |
| 20 Day | ₹ 91.038 |
| 50 Day | ₹ 88.228 |
| 100 Day | ₹ 89.218 |
| 200 Day | ₹ 84.617 |
Arfin India Ltd Fundamentals
| ROCE | 13.407 |
| P/E Ratio | 110.870 |
| P/B Ratio | 10.550 |
| Industry P/E | 10.550 |
| Debt to Equity | 16.551 |
| ROE | 8.070 |
| EPS | 0.950 |
| Dividend Yield | 0.100 |
| Book Value | 9.987 |
| Face Value | 1.000 |
Arfin India Ltd Financials
| Particulars | Y202603 | Y202503 | Y202403 | Y202303 | Y202203 |
|---|---|---|---|---|---|
| Total Revenue | 626.1148 | 617.7122 | 537.1474 | 546.5956 | 527.6172 |
| Total Expenses | 604.8864 | 603.3282 | 527.4295 | 535.6141 | 517.8145 |
| Profit After Tax | 13.5971 | 9.151 | 8.2204 | 10.3168 | 9.1873 |
Arfin India Ltd Shareholding Pattern
| Promoter Holdings | 69.772 % |
| FIIs | 0.793 % |
| DIIs | 0.000 % |
| MutualFund | 0.000 % |
| Retail | 15.594 % |
| Others - | 13.840 % |
About Arfin India Ltd
Arfin India Limited was incorporated on 10 April, 1992 as a Public Limited Company. The Company has evolved into a dynamic and diversified manufacturing enterprise, establishing a strong presence across the Aluminium, Ferro Alloys and Power Transmission sectors. The Company is engaged in the business of manufacturing, trading and selling of various non-ferrous metal products since its manufacturing activities are located at Chhatral, Dhanot and Vadaswami industrial areas in the State of Gujarat. The Company possesses an inherent production capacity of 71,000 metric tonnes per annum, supporting a diverse range of main products such as Aluminium Wire Rod, Aluminium Deox, Cored Wire, Aluminium Alloy Ingots, Ferro Titanium, and Conductor & Cables. With the installed capacity of over 71,000 metric tonnes per annum and ongoing investments in automation and new product lines, the Company has strengthened the competitive advantage across the domestic and global markets. The Company added additional capacity of 5,000 metric tons per annum through mechanization of existing machines during the year 2014-15. Cored Wire Mill Plant commissioned in March, 2015. In 2014-15, the company expanded its reach into the steel sector by extending its manufacturing strength to produce cored wire products which was followed by set up of Alloy Ingots Plant during 2015-16 and Ferro Alloys Plant during 2016-17. During 2017-18, the Company started supplying to Power Sector through its Conductor ...
Similar Stocks
| Hindalco Industries Ltd Non Ferrous Metals | ₹ 900.35 +10.2 (+1.15%) |
| Vedanta Ltd Non Ferrous Metals | ₹ 264.00 +10.9 (+4.31%) |
| Shivalik Bimetal Controls Ltd Non Ferrous Metals | ₹ 1,041.60 -9 (-0.86%) |
| Century Extrusions Ltd Non Ferrous Metals | ₹ 17.87 -0.73 (-3.92%) |
| National Aluminium Company Ltd Non Ferrous Metals | ₹ 315.90 +2.8 (+0.89%) |
| Hindustan Zinc Ltd Non Ferrous Metals | ₹ 543.50 +11.75 (+2.21%) |
FAQs on Arfin India Ltd
1. Can I buy Arfin India Ltd from PL Capital? ›
2. Does Arfin India Ltd pay dividends? ›
3. What is the current share price of Arfin India Ltd ? ›
4. What is the 52-week high and low of Arfin India Ltd ? ›
5. What is the market capitalisation of Arfin India Ltd? ›
6. What is the current P/E ratio of Arfin India Ltd? ›
7. What is the current P/B ratio of Arfin India Ltd? ›
8. What is the shareholding pattern of Arfin India Ltd? ›
9. What is the 1-year return of Arfin India Ltd? ›

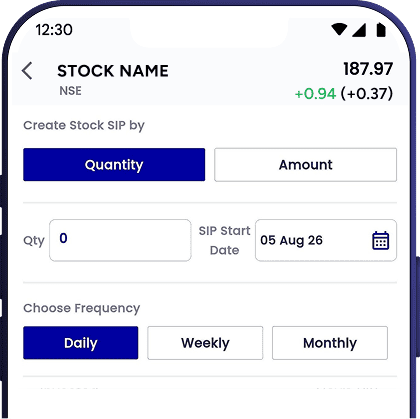
Start SIP in Arfin India Ltd
Invest systematically in stocks with the
PL Capital app

Are you a new user? Open your account