
Clean Science & Technology Ltd
Clean Science & Technology Ltd Live Price Chart


Performance
| Previous Close | ₹ 748.05 |
| High | ₹ 744.6 |
| Volume | 422494 |
| 52W Range | ₹ 652 - ₹ 1069.8 |
| Open | ₹ 742.6 |
| Low | ₹ 714.35 |
| Market Cap | ₹ 8648.87 Cr |
Clean Science & Technology Ltd Technicals
| 20 Day | ₹ 791.093 |
| 50 Day | ₹ 800.378 |
| 100 Day | ₹ 800.433 |
| 200 Day | ₹ 837.462 |
| 20 Day | ₹ 793.853 |
| 50 Day | ₹ 816.381 |
| 100 Day | ₹ 792.362 |
| 200 Day | ₹ 786.125 |
Clean Science & Technology Ltd Fundamentals
| ROCE | 20.372 |
| P/E Ratio | 32.090 |
| P/B Ratio | 4.840 |
| Industry P/E | 4.840 |
| Debt to Equity | 36.655 |
| ROE | 15.266 |
| EPS | 23.330 |
| Dividend Yield | 0.800 |
| Book Value | 154.835 |
| Face Value | 1.000 |
Clean Science & Technology Ltd Financials
| Particulars | Y202603 | Y202503 | Y202403 | Y202303 | Y202203 |
|---|---|---|---|---|---|
| Total Revenue | 842.839 | 958.499 | 827.79 | 974.596 | 714.825 |
| Total Expenses | 507.228 | 567.949 | 496.809 | 569.147 | 409.926 |
| Profit After Tax | 251.217 | 292.302 | 247.688 | 303.51 | 228.606 |
Clean Science & Technology Ltd Shareholding Pattern
| Promoter Holdings | 51.290 % |
| FIIs | 13.720 % |
| DIIs | 4.158 % |
| MutualFund | 10.938 % |
| Retail | 12.939 % |
| Others - | 6.956 % |
About Clean Science & Technology Ltd
Clean Science and Technology Limited was originally incorporated as 'Sri Distikemi Private Limited' on 07 November 2003 in Pune, Maharashtra as a Private Limited Company. Thereafter, name of the Company changed to Clean Science and Technology Private Limited' on 31 July, 2006. Subsequently, Company was converted into a Public Company on 25 February, 2021 and name of the Company was changed to 'Clean Science and Technology Limited' via fresh Certificate of Incorporation issued by ROC on 4 March, 2021. The Company is engaged in the manufacturing and export of various types of chemicals mainly MEHQ, Guaiacol, 4MAP at its manufacturing plant at Kurkumbh MIDC, Pune. The Company is amongst few global companies focused entirely on developing newer technologies using in-house catalytic processes, which are eco-friendly and cost competitive. This has enabled to emerge as the largest manufacturer globally of certain specialty chemicals in terms of manufacturing capacities. It has 3 certified production facilities in India strategically located at Kurkumbh (Maharashtra), in close proximity to the JNPT port from where the Company export majority of products. Each facility has an independent R&D unit, quality control department, warehouse, engineering & utility section and all our facilities are zero liquid discharge facilities. The Board of Directors of the Company at its meeting held on 20 March 2020 had approved a proposal to buyback up to 87,990 equity shares of the company for ...
Similar Stocks
| Atul Ltd Chemicals | ₹ 5,816.00 -183.5 (-3.06%) |
| BASF India Ltd Chemicals | ₹ 3,062.50 -126.2 (-3.96%) |
| Oriental Aromatics Ltd Chemicals | ₹ 571.85 -17.55 (-2.98%) |
| DIC India Ltd Chemicals | ₹ 522.95 -36.7 (-6.56%) |
| Sudarshan Colorants India Ltd Chemicals | ₹ 320.20 -22.2 (-6.48%) |
| Deepak Fertilisers & Petrochemicals Corp Ltd Chemicals | ₹ 1,130.50 -48.3 (-4.1%) |
FAQs on Clean Science & Technology Ltd
1. Can I buy Clean Science & Technology Ltd from PL Capital? ›
2. Does Clean Science & Technology Ltd pay dividends? ›
3. What is the current share price of Clean Science & Technology Ltd ? ›
4. What is the 52-week high and low of Clean Science & Technology Ltd ? ›
5. What is the market capitalisation of Clean Science & Technology Ltd? ›
6. What is the current P/E ratio of Clean Science & Technology Ltd? ›
7. What is the current P/B ratio of Clean Science & Technology Ltd? ›
8. What is the shareholding pattern of Clean Science & Technology Ltd? ›
9. What is the 1-year return of Clean Science & Technology Ltd? ›

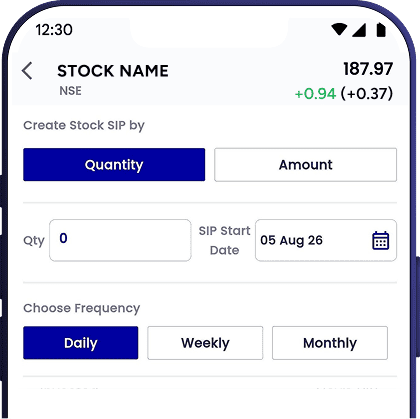
Start SIP in Clean Science & Technology Ltd
Invest systematically in stocks with the
PL Capital app

Are you a new user? Open your account