
Kalyan Capitals Ltd
Kalyan Capitals Ltd Live Price Chart


Performance
| Previous Close | ₹ 6.12 |
| High | ₹ 6.26 |
| Volume | 3625 |
| 52W Range | ₹ 4.46 - ₹ 10.25 |
| Open | ₹ 6.17 |
| Low | ₹ 6 |
| Market Cap | ₹ 33.5 Cr |
Kalyan Capitals Ltd Technicals
| 20 Day | ₹ 6.364 |
| 50 Day | ₹ 6.696 |
| 100 Day | ₹ 7.024 |
| 200 Day | ₹ 7.441 |
| 20 Day | ₹ 6.375 |
| 50 Day | ₹ 6.658 |
| 100 Day | ₹ 7.450 |
| 200 Day | ₹ 7.160 |
Kalyan Capitals Ltd Fundamentals
| ROCE | 7.310 |
| P/E Ratio | 61.700 |
| P/B Ratio | 0.960 |
| Industry P/E | 0.960 |
| Debt to Equity | 21.496 |
| ROE | 4.665 |
| EPS | 0.100 |
| Dividend Yield | 0.000 |
| Book Value | 6.458 |
| Face Value | 2.000 |
Kalyan Capitals Ltd Financials
| Particulars | Y202503 | Y202403 | Y202303 | Y202203 | Y202103 |
|---|---|---|---|---|---|
| Total Revenue | 19.0979 | 19.9944 | 15.1518 | 4.0943 | 0.3945 |
| Total Expenses | 16.9262 | 18.0354 | 12.9731 | 3.555 | 0.3835 |
| Profit After Tax | 1.6012 | 1.3597 | 1.6763 | 0.4162 | 0.0089 |
Kalyan Capitals Ltd Shareholding Pattern
| Promoter Holdings | 67.612 % |
| FIIs | 0.000 % |
| DIIs | 0.000 % |
| MutualFund | 0.000 % |
| Retail | 25.604 % |
| Others - | 6.784 % |
About Kalyan Capitals Ltd
Kalyan Capitals Limited, formerly known Akashdeep Metal Industries Limited was incorporated on December 12, 1983. The name of the Company was changed Akashdeep Metal Industries Limited to Kalyan Capitals Limited on April 25th, 2023. The Company engaged in the business of investment in securities and providing loans and advances. Mr. Rajesh Gupta and his PACs had proposed for Change in Control and to act as Promoter and Promoter Group of the Company through Letter of Offer dated February 22, 2018. However, the final report for Change in Control was filled by Manager to Offer on 2nd April 2018. Hence from F.Y 2018-19 onwards, Mr. Rajesh Gupta and his PACs categorized as Promoter and Promoter Group. In 2018, M/s. Anmol Financial Services Limited became wholly owned subsidiary of the Company w.e.f 27th February 2018. In 2020-21, the Company sold 10,84,071 Equity shares held in its wholly-owned subsidiary company i.e., Anmol Financial Services Limited (AFSL) constituting 18.69% of AFSL to the promoters/promoter group of the Company. Consequently, AFSL ceased to be the wholly owned subsidiary of the Company. Company expanded its geography by reaching out to underserved semi urban areas and increased its footprint by operationalize a Gold Loan scheme in Delhi and opening new branch in FY24. ...
Similar Stocks
| Alfred Herbert (India) Ltd Finance | ₹ 2,770.00 -29.9 (-1.07%) |
| Aravali Securities & Finance Ltd Finance | ₹ 3.87 -0.2 (-4.91%) |
| Bajaj Holdings & Investment Ltd Finance | ₹ 11,068.00 -143.65 (-1.28%) |
| Tata Investment Corporation Ltd Finance | ₹ 613.20 +2.65 (+0.43%) |
| Maharashtra Scooters Ltd Finance | ₹ 12,363.00 -69.35 (-0.56%) |
| Max Financial Services Ltd Finance | ₹ 1,293.95 +15 (+1.17%) |
FAQs on Kalyan Capitals Ltd
1. Can I buy Kalyan Capitals Ltd from PL Capital? ›
2. Does Kalyan Capitals Ltd pay dividends? ›
3. What is the current share price of Kalyan Capitals Ltd ? ›
4. What is the 52-week high and low of Kalyan Capitals Ltd ? ›
5. What is the market capitalisation of Kalyan Capitals Ltd? ›
6. What is the current P/E ratio of Kalyan Capitals Ltd? ›
7. What is the current P/B ratio of Kalyan Capitals Ltd? ›
8. What is the shareholding pattern of Kalyan Capitals Ltd? ›
9. What is the 1-year return of Kalyan Capitals Ltd? ›

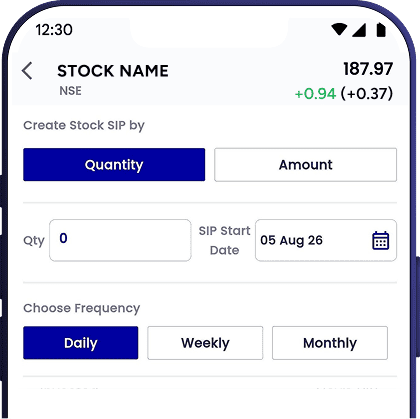
Start SIP in Kalyan Capitals Ltd
Invest systematically in stocks with the
PL Capital app

Are you a new user? Open your account