
Kovalam Investment & Trading Co. Ltd
Kovalam Investment & Trading Co. Ltd Live Price Chart


Performance
| Previous Close | ₹ |
| High | ₹ |
| Volume | |
| 52W Range | ₹ - ₹ |
| Open | ₹ |
| Low | ₹ |
| Market Cap | ₹ 3.14 Cr |
Kovalam Investment & Trading Co. Ltd Technicals
| 20 Day | ₹ 0.000 |
| 50 Day | ₹ 0.000 |
| 100 Day | ₹ 0.000 |
| 200 Day | ₹ 0.000 |
| 20 Day | ₹ 0.000 |
| 50 Day | ₹ 0.000 |
| 100 Day | ₹ 0.000 |
| 200 Day | ₹ 0.000 |
Kovalam Investment & Trading Co. Ltd Fundamentals
| ROCE | 2.432 |
| P/E Ratio | 1.690 |
| P/B Ratio | 0.040 |
| Industry P/E | 0.040 |
| Debt to Equity | 21.354 |
| ROE | 1.857 |
| EPS | 8.340 |
| Dividend Yield | 0.000 |
| Book Value | 326.269 |
| Face Value | 10.000 |
Kovalam Investment & Trading Co. Ltd Financials
| Particulars | Y202603 | Y202503 | Y202403 | Y202303 | Y202203 |
|---|---|---|---|---|---|
| Total Revenue | 2.5145137 | 2.167713 | 3.6099821 | 2.1552792 | 2.1088468 |
| Total Expenses | 0.6551026 | 0.1873616 | 0.1167125 | 0.5692696 | 0.1199687 |
| Profit After Tax | 1.3452171 | 1.6448559 | 3.051509 | 1.0222891 | 1.8094096 |
Kovalam Investment & Trading Co. Ltd Shareholding Pattern
| Promoter Holdings | 74.946 % |
| FIIs | 0.000 % |
| DIIs | 0.000 % |
| MutualFund | 0.000 % |
| Retail | 21.535 % |
| Others - | 3.519 % |
About Kovalam Investment & Trading Co. Ltd
Kovalam Investment & Trading Company Limited was incorporated on 28 November 1981. Pursuant to RBI's regulatory framework, the Company is a Non- Banking Financial Company registered under Reserve Bank of India (RBI) vide registration number N-06.00576 dated October 17, 2003 and involved in the activities of Investment in shares as well as trading and financing activities. The Securities and Exchange Board of India (SEBI), on September 2, 2015 issued SEBI (Listing Obligations and Disclosures Requirements) Regulations, 2015. The said Regulation became effective from 1st December 2015. In compliance of said Regulations, the company entered into Listing Agreement with the BSE Ltd. on 23rd February 2016. In FY19, Hug Foods Private Limited ceased to be an Associate Company w.e.f. 26 November 2018. During the financial year 2024-25, Company has changed the pattern of allocation of funds. It increased lending to known Business associates and Group Companies for safety and higher returns. ...
Similar Stocks
| Alfred Herbert (India) Ltd Finance | ₹ 2,711.00 -88.9 (-3.18%) |
| Aravali Securities & Finance Ltd Finance | ₹ 4.50 -0.18 (-3.85%) |
| Bajaj Holdings & Investment Ltd Finance | ₹ 10,800.00 +145.6 (+1.37%) |
| Tata Investment Corporation Ltd Finance | ₹ 599.40 -8.95 (-1.47%) |
| Maharashtra Scooters Ltd Finance | ₹ 12,191.95 +154.8 (+1.29%) |
| Max Financial Services Ltd Finance | ₹ 1,310.00 -10.05 (-0.76%) |
FAQs on Kovalam Investment & Trading Co. Ltd
1. Can I buy Kovalam Investment & Trading Co. Ltd from PL Capital? ›
2. Does Kovalam Investment & Trading Co. Ltd pay dividends? ›
3. What is the current share price of Kovalam Investment & Trading Co. Ltd ? ›
4. What is the 52-week high and low of Kovalam Investment & Trading Co. Ltd ? ›
5. What is the market capitalisation of Kovalam Investment & Trading Co. Ltd? ›
6. What is the current P/E ratio of Kovalam Investment & Trading Co. Ltd? ›
7. What is the current P/B ratio of Kovalam Investment & Trading Co. Ltd? ›
8. What is the shareholding pattern of Kovalam Investment & Trading Co. Ltd? ›
9. What is the 1-year return of Kovalam Investment & Trading Co. Ltd? ›

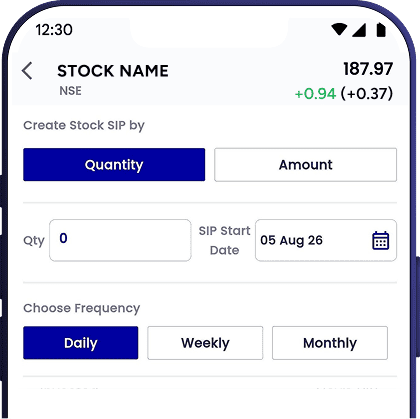
Start SIP in Kovalam Investment & Trading Co. Ltd
Invest systematically in stocks with the
PL Capital app

Are you a new user? Open your account