
S & T Corporation Ltd
S & T Corporation Ltd Live Price Chart


Performance
| Previous Close | ₹ 4.18 |
| High | ₹ 4.29 |
| Volume | 9808 |
| 52W Range | ₹ 3.25 - ₹ 7.3 |
| Open | ₹ 4.18 |
| Low | ₹ 4.18 |
| Market Cap | ₹ 13.37 Cr |
S & T Corporation Ltd Technicals
| 20 Day | ₹ 4.235 |
| 50 Day | ₹ 4.291 |
| 100 Day | ₹ 4.348 |
| 200 Day | ₹ 4.643 |
| 20 Day | ₹ 4.176 |
| 50 Day | ₹ 4.446 |
| 100 Day | ₹ 4.245 |
| 200 Day | ₹ 4.449 |
S & T Corporation Ltd Fundamentals
| ROCE | 0.066 |
| P/E Ratio | -139.330 |
| P/B Ratio | 1.020 |
| Industry P/E | 1.020 |
| Debt to Equity | 47.094 |
| ROE | 0.095 |
| EPS | -0.030 |
| Dividend Yield | 0.000 |
| Book Value | 4.098 |
| Face Value | 2.000 |
S & T Corporation Ltd Financials
| Particulars | Y202603 | Y202503 | Y202403 | Y202303 | Y202203 |
|---|---|---|---|---|---|
| Total Revenue | 2.5017 | 0.4554 | 0.2114 | 0.5429 | 0.9892 |
| Total Expenses | 2.4893 | 0.3857 | 0.3641 | 0.4139 | 0.3091 |
| Profit After Tax | 0.0124 | 0.0697 | -0.1527 | 0.129 | 0.6801 |
S & T Corporation Ltd Shareholding Pattern
| Promoter Holdings | 55.370 % |
| FIIs | 0.000 % |
| DIIs | 0.000 % |
| MutualFund | 0.000 % |
| Retail | 43.646 % |
| Others - | 0.983 % |
About S & T Corporation Ltd
S & T Corporation Limited was incorporated in June, 1984. The Company after merger has been in a turnaround stage with new businesses, increased customer base and value of stakeholders. The Company started a venture in food industries. It further ventured into manufacturing of bakery products. During year 2011, the company entered into partnership with Rajyog Enterprise to purchase, acquire & sell properties & carry out real estate development work & sell shops/flats/premises constructed on said properties. The commercial production started in 2018. Promoters of the Company have a vision to take ahead real estate projects on large scale in Mumbai as well as other cities like Nashik & Goa. There is huge scope of land development, development and self redevelopment in Mumbai. The Promoters have further built many real estate projects in Mumbai as well as in other cities and have good hands-on experience in construction as well land development. The Company is doing various projects in Joint Ventures / Partnerships at Chembur, Malad & Goregaon. There is a good scope of development in these areas as there is a very good demand for residential and commercial spaces. Several factors of the Company have combined to push prices up in Mumbai. The wealth effect of rising income levels due to better wages, combined with the relentless growth of services (financial services, technology, BPO, retail, etc.), has spawned a huge unmet demand for quality residential as well as offic ...
Similar Stocks
| Arvind Ltd Textiles | ₹ 520.30 +4.15 (+0.8%) |
| Blue Blends (India) Ltd Textiles | - |
| Bombay Dyeing & Manufacturing Company Ltd Textiles | ₹ 98.00 +0.9 (+0.93%) |
| Century Enka Ltd Textiles | ₹ 561.35 +7.65 (+1.38%) |
| Delta Manufacturing Ltd Textiles | ₹ 58.45 +3.45 (+6.27%) |
| Garware Technical Fibres Ltd Textiles | ₹ 765.00 -1.2 (-0.16%) |
FAQs on S & T Corporation Ltd
1. Can I buy S & T Corporation Ltd from PL Capital? ›
2. Does S & T Corporation Ltd pay dividends? ›
3. What is the current share price of S & T Corporation Ltd ? ›
4. What is the 52-week high and low of S & T Corporation Ltd ? ›
5. What is the market capitalisation of S & T Corporation Ltd? ›
6. What is the current P/E ratio of S & T Corporation Ltd? ›
7. What is the current P/B ratio of S & T Corporation Ltd? ›
8. What is the shareholding pattern of S & T Corporation Ltd? ›
9. What is the 1-year return of S & T Corporation Ltd? ›

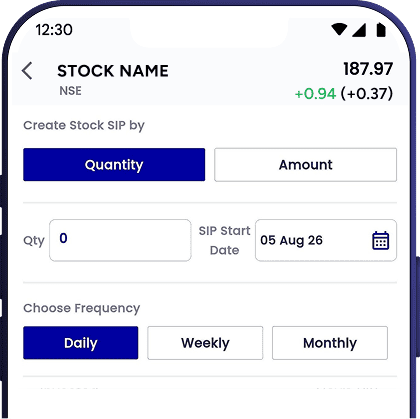
Start SIP in S & T Corporation Ltd
Invest systematically in stocks with the
PL Capital app

Are you a new user? Open your account