
Redington Ltd
Redington Ltd Live Price Chart


Performance
| Previous Close | ₹ 388 |
| High | ₹ 399.45 |
| Volume | 2893774 |
| 52W Range | ₹ 191.31 - ₹ 419.5 |
| Open | ₹ 388.1 |
| Low | ₹ 377.95 |
| Market Cap | ₹ 31763.5 Cr |
Redington Ltd Technicals
| 20 Day | ₹ 393.391 |
| 50 Day | ₹ 366.807 |
| 100 Day | ₹ 331.699 |
| 200 Day | ₹ 299.523 |
| 20 Day | ₹ 398.810 |
| 50 Day | ₹ 370.233 |
| 100 Day | ₹ 313.997 |
| 200 Day | ₹ 279.396 |
Redington Ltd Fundamentals
| ROCE | 24.814 |
| P/E Ratio | 21.770 |
| P/B Ratio | 5.600 |
| Industry P/E | 5.600 |
| Debt to Equity | 66.298 |
| ROE | 23.457 |
| EPS | 17.460 |
| Dividend Yield | 1.580 |
| Book Value | 67.832 |
| Face Value | 2.000 |
Redington Ltd Financials
| Particulars | Y202603 | Y202503 | Y202403 | Y202303 | Y202203 |
|---|---|---|---|---|---|
| Total Revenue | 64183.99 | 49643.58 | 41740.56 | 35862.14 | 27506.47 |
| Total Expenses | 62612.93 | 47945.37 | 40437.27 | 34585.94 | 26402.07 |
| Profit After Tax | 1243.9 | 1443.76 | 1081.24 | 1071.88 | 935.07 |
Redington Ltd Shareholding Pattern
| Promoter Holdings | 0.000 % |
| FIIs | 61.961 % |
| DIIs | 5.414 % |
| MutualFund | 10.959 % |
| Retail | 16.323 % |
| Others - | 5.344 % |
About Redington Ltd
An integrated supply chain solution provider, Redington Limited, formerly known Redington India Limited was incorporated on 2 May, 1961. The name was changed to Redington Limited in FY2023. Company is engaged in distribution of Information Technology, mobility and other technology products besides supply chain solutions. It provides logistics, supply chain management and other support services in India, Middle East, Turkey, Africa and South Asian countries. The Company commenced its operations in the year 1993 by distributing information technology products. From then on the company has continuously expanded its operations across India covering a broad range of IT and Telecom Products. During the year 1994, commenced service operations for IT products, distribution of Epson and Tripplite IT products, and distribution of Samsung monitors, also commenced its operations in Northern India. A year after, in 1995, Redington had started its operations in Eastern India, also in the same year the company had commenced distribution of Compaq and Philips products. The distributions of Intel products were started by the company in the year 1996. The Company made tie-up with Microsoft for distribution of software products in the year 1997 and also made tie-up with IBM, APC and Canon for distribution of their products in the year 1998. Hewlett Packard honored the company as an excellent service provider' in the year of 2000. The call centre operations of the company were started in ...
Similar Stocks
| Aegis Logistics Ltd Trading | ₹ 1,388.90 +6.6 (+0.48%) |
| Kothari Industrial Corporation Ltd Trading | ₹ 162.99 +7.85 (+5.06%) |
| Oswal Agro Mills Ltd Trading | ₹ 31.69 -0.27 (-0.84%) |
| Dhunseri Ventures Ltd Trading | ₹ 279.30 +9.05 (+3.35%) |
| National Standard (India) Ltd Trading | ₹ 105.26 +0.36 (+0.34%) |
| Oricon Enterprises Ltd Trading | ₹ 51.10 +0.38 (+0.75%) |
FAQs on Redington Ltd
1. Can I buy Redington Ltd from PL Capital? ›
2. Does Redington Ltd pay dividends? ›
3. What is the current share price of Redington Ltd ? ›
4. What is the 52-week high and low of Redington Ltd ? ›
5. What is the market capitalisation of Redington Ltd? ›
6. What is the current P/E ratio of Redington Ltd? ›
7. What is the current P/B ratio of Redington Ltd? ›
8. What is the shareholding pattern of Redington Ltd? ›
9. What is the 1-year return of Redington Ltd? ›

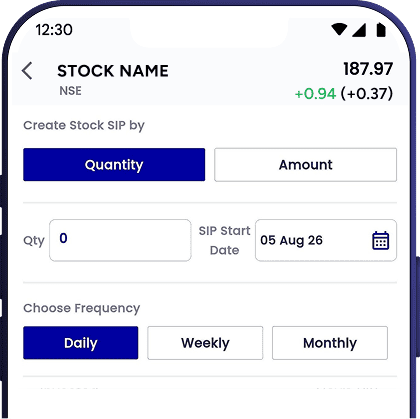
Start SIP in Redington Ltd
Invest systematically in stocks with the
PL Capital app

Are you a new user? Open your account