
S P Apparels Ltd
S P Apparels Ltd Live Price Chart


Performance
| Previous Close | ₹ 922.8 |
| High | ₹ 932.1 |
| Volume | 27703 |
| 52W Range | ₹ 600 - ₹ 1221.9 |
| Open | ₹ 927 |
| Low | ₹ 905 |
| Market Cap | ₹ 2425.9 Cr |
S P Apparels Ltd Technicals
| 20 Day | ₹ 961.825 |
| 50 Day | ₹ 976.253 |
| 100 Day | ₹ 950.159 |
| 200 Day | ₹ 894.361 |
| 20 Day | ₹ 966.825 |
| 50 Day | ₹ 986.963 |
| 100 Day | ₹ 969.385 |
| 200 Day | ₹ 846.925 |
S P Apparels Ltd Fundamentals
| ROCE | 11.933 |
| P/E Ratio | 24.320 |
| P/B Ratio | 2.450 |
| Industry P/E | 2.450 |
| Debt to Equity | 45.908 |
| ROE | 9.350 |
| EPS | 37.590 |
| Dividend Yield | 0.330 |
| Book Value | 373.702 |
| Face Value | 10.000 |
S P Apparels Ltd Financials
| Particulars | Y202603 | Y202503 | Y202403 | Y202303 | Y202203 |
|---|---|---|---|---|---|
| Total Revenue | 1120.21 | 989.006 | 963.984 | 962.32 | 744.457 |
| Total Expenses | 1000.575 | 877.259 | 828.29 | 840.045 | 623.676 |
| Profit After Tax | 87.842 | 83.532 | 103.762 | 91.813 | 91.435 |
S P Apparels Ltd Shareholding Pattern
| Promoter Holdings | 61.812 % |
| FIIs | 1.491 % |
| DIIs | 1.506 % |
| MutualFund | 14.645 % |
| Retail | 15.200 % |
| Others - | 5.348 % |
About S P Apparels Ltd
S.P. Apparels Limited (SPAL) is a leading manufacturer and exporter of knitted garments for infants and children in India. With the large network of factories, the Company serves as a sourcing, manufacturing and supply chain platform with a market growth headed by children and kids wear. The Company operates a vertically integrated manufacturing model spanning spinning, dyeing, processing, and garmenting, enabling consistent quality, cost efficiency, and supply chain reliability. SPAL core business is anchored by its garment division, which specializes in infant wear and children's apparel for global markets. S.P. Apparels came out with an initial public offer (IPO) in August 2016. The IPO included 80,22,388 equity shares as fresh issue and 9,00,000 equity shares by way of Offer for sale by New York Life Investment Management India Fund (FVCI) II LLC. During the financial year ended 31 March 2016, the company added 120 new sewing machines. The Processing Division achieved 85% utilization of its capacity. The embroidery and printing factories achieved 90% of their capacities during the year. The efficiency level of the factories of the Garment Division has shown improvement in the range of 5% to 10% during the year under review. The retail division has shown significant growth in terms of increase of retail stores to 40 across the country. During the year under review, the company converted 72,49,454 numbers of 6% Compulsorily Convertible Preference Shares (6% CC ...
Similar Stocks
| Zodiac Clothing Company Ltd Readymade Garments/Apparels | ₹ 65.31 -0.88 (-1.33%) |
| Kitex Garments Ltd Readymade Garments/Apparels | ₹ 115.01 -0.1 (-0.09%) |
| Page Industries Ltd Readymade Garments/Apparels | ₹ 36,875.00 +425 (+1.17%) |
| Gokaldas Exports Ltd Readymade Garments/Apparels | ₹ 667.70 +15.35 (+2.35%) |
| Dollar Industries Ltd Readymade Garments/Apparels | ₹ 271.50 -8.05 (-2.88%) |
| Celebrity Fashions Ltd Readymade Garments/Apparels | ₹ 6.08 +0.08 (+1.33%) |
FAQs on S P Apparels Ltd
1. Can I buy S P Apparels Ltd from PL Capital? ›
2. Does S P Apparels Ltd pay dividends? ›
3. What is the current share price of S P Apparels Ltd ? ›
4. What is the 52-week high and low of S P Apparels Ltd ? ›
5. What is the market capitalisation of S P Apparels Ltd? ›
6. What is the current P/E ratio of S P Apparels Ltd? ›
7. What is the current P/B ratio of S P Apparels Ltd? ›
8. What is the shareholding pattern of S P Apparels Ltd? ›
9. What is the 1-year return of S P Apparels Ltd? ›

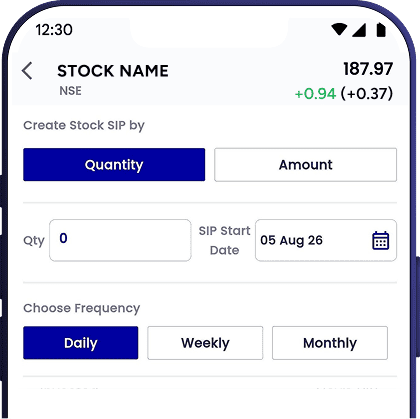
Start SIP in S P Apparels Ltd
Invest systematically in stocks with the
PL Capital app

Are you a new user? Open your account