
EFC (I) Ltd
EFC (I) Ltd Live Price Chart


Performance
| Previous Close | ₹ 167.07 |
| High | ₹ 170.38 |
| Volume | 165939 |
| 52W Range | ₹ 165.59 - ₹ 330.67 |
| Open | ₹ 170.38 |
| Low | ₹ 165.59 |
| Market Cap | ₹ 2609.06 Cr |
EFC (I) Ltd Technicals
| 20 Day | ₹ 176.620 |
| 50 Day | ₹ 183.125 |
| 100 Day | ₹ 190.649 |
| 200 Day | ₹ 208.371 |
| 20 Day | ₹ 176.635 |
| 50 Day | ₹ 185.315 |
| 100 Day | ₹ 187.342 |
| 200 Day | ₹ 209.543 |
EFC (I) Ltd Fundamentals
| ROCE | 18.336 |
| P/E Ratio | 37.010 |
| P/B Ratio | 3.350 |
| Industry P/E | 3.350 |
| Debt to Equity | 45.989 |
| ROE | 14.951 |
| EPS | 4.580 |
| Dividend Yield | 0.000 |
| Book Value | 50.548 |
| Face Value | 2.000 |
EFC (I) Ltd Financials
| Particulars | Y202603 | Y202503 | Y202403 | Y202303 | Y202203 |
|---|---|---|---|---|---|
| Total Revenue | 485.7247 | 295.0335 | 19.5936 | 7.0323 | 0.1059 |
| Total Expenses | 373.6199 | 189.8886 | 16.0756 | 5.9473 | 0.0868 |
| Profit After Tax | 81.3345 | 78.175 | 2.5394 | 0.4908 | 0.0126 |
EFC (I) Ltd Shareholding Pattern
| Promoter Holdings | 56.080 % |
| FIIs | 1.258 % |
| DIIs | 5.927 % |
| MutualFund | 2.950 % |
| Retail | 18.292 % |
| Others - | 15.494 % |
About EFC (I) Ltd
EFC (I) Limited, formerly known 'Amani Trading and Exports Limited' was incorporated on February 27, 1984. The name of the Company was changed to EFC (I) Limited on July 16, 2022. The Company has evolved from a managed workspace operator into a fully integrated real estate solutions platform comprising three synergistic business verticals: Leasing (Managed Workspaces), Design & Build (Interior Fit-Outs), and Furniture Manufacturing. The Company operates through a multi-brand portfolio that serves enterprise clients, SMEs, startups, and institutional entities alike, across 25 cities with over 78,000+ seats under management. As a 'Real Estate as a Service' company, it enables clients to shift from capital-intensive real estate ownership to flexible, professionally managed OpEx-based workspace solutions, to focus on their core business objectives. In financial year 2023, the Company achieved remarkable feats through which, EFC (I) Limited boasts more than 23,000 seats. The Company was taken over by new promoters, management during the FY2022-23. It acquired 100% shareholding of EFC Limited, making it a wholly owned subsidiary. The Company acquired 51% stake in Bigbox Ventures Pvt Ltd., making it subsidiary in 2024. In FY 2025, Company acquired premium commercial assets in Pune. It expanded the furniture manufacturing division by introducing mirové, a brand designed for high-end residential, hospitality, and designer-led spaces to increase production capacity. New ...
Similar Stocks
| Aditya Birla Real Estate Ltd Realty | ₹ 1,022.30 +4.3 (+0.42%) |
| Elpro International Ltd Realty | ₹ 172.49 -2.04 (-1.17%) |
| Golden Tobacco Ltd Realty | ₹ 21.74 -0.34 (-1.54%) |
| Peninsula Land Ltd Realty | ₹ 14.50 -0.1 (-0.68%) |
| AMJ Land Holdings Ltd Realty | ₹ 36.26 -0.4 (-1.09%) |
| Texmaco Infrastructure & Holdings Ltd Realty | ₹ 118.07 -1.97 (-1.64%) |
FAQs on EFC (I) Ltd
1. Can I buy EFC (I) Ltd from PL Capital? ›
2. Does EFC (I) Ltd pay dividends? ›
3. What is the current share price of EFC (I) Ltd ? ›
4. What is the 52-week high and low of EFC (I) Ltd ? ›
5. What is the market capitalisation of EFC (I) Ltd? ›
6. What is the current P/E ratio of EFC (I) Ltd? ›
7. What is the current P/B ratio of EFC (I) Ltd? ›
8. What is the shareholding pattern of EFC (I) Ltd? ›
9. What is the 1-year return of EFC (I) Ltd? ›

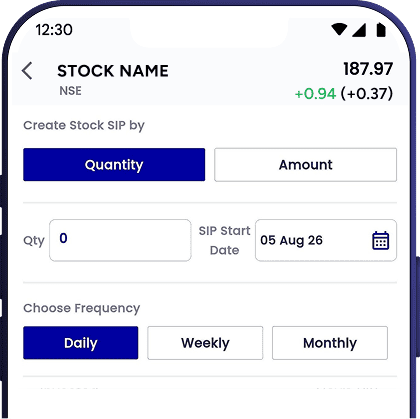
Start SIP in EFC (I) Ltd
Invest systematically in stocks with the
PL Capital app

Are you a new user? Open your account