What is the Morning Star Pattern?
- 12th November 2025
- 05:50 PM
- 7 min read
The morning star pattern in a technical chart indicates a potential upward trend in asset prices after a downtrend. It typically forecasts a translation from a bearish sentiment towards a bullish one, and calls it a bullish reversal formation. About 10.7 crore Indians directly invest in the stock market, and if you are one of them and into trading, you must learn how this pattern works.
The Morning Star Candlestick Structure and Its Indications
If you are into stock market trades and want to make optimal profits, you must know about a morning star pattern that appears at the bottom of a downtrend of an asset’s prices. It typically indicates that selling pressure is getting weaker and buyers are taking over.
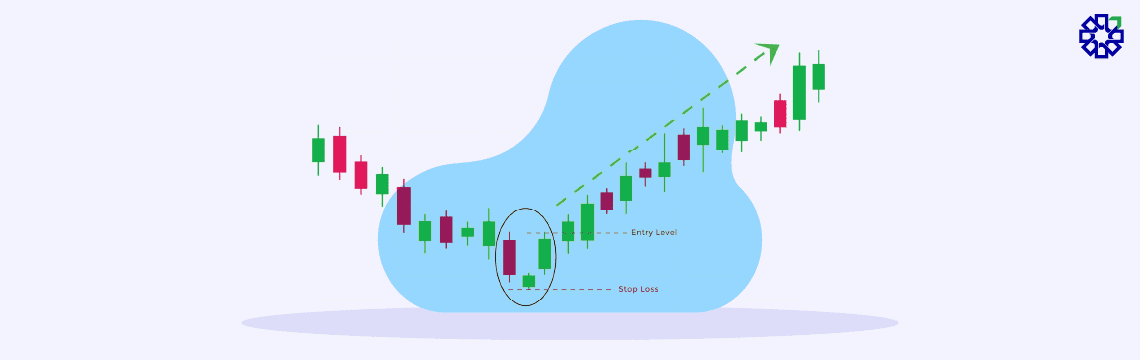
In a technical analysis chart, a morning star appears with 3 candlesticks. Here, its first candle indicates the prior downtrend. A second candle represents a market indecision. Its third candle in this pattern indicates the bullish reversal.
These indications of the morningstar candlestick typically represent a potential bullish reversal signal that might stay for several days, and asset prices might keep going upwards.
How to Identify a Morning Star Pattern?
As an investor or a trader, you might see day trading as a potential source of making market profit. However, about 80% of day traders quit trading within 2 years due to ineffective strategies.
Therefore, among other technical analysis patterns, you must learn how to locate this bullish reversal pattern for trading and strategise accordingly. Here is how you can identify them using their colour, size, etc:
-
First Candle of Bearish Movement
When the morning star pattern occurs, the first candle represents the bear’s control over the asset prices, pushing them downwards. It is typically longer and red in colour. Suppose a stock has been falling steadily, dropping from INR 460 to INR 420 with heavy selling pressure, forming the first red candle that signals strong bearish momentum.
-
Second Candle of Indecision
If the market slows down after the previous strong fall, a small second candle might appear. It highlights that the asset prices have not moved that much and hints at uncertainty among traders. If it appears as a doji, it typically indicates a change in market direction.
-
Third Candle of Bullish Reversal
In a morning star pattern, if a green candle appears above the close of the second pattern and close to the halfway point into the body of the first candle, it represents buying pressure. Continuing from the earlier example, now suppose the stock opens at INR 425 and surges to close at INR 445, forming a strong green candle, suggesting a bullish reversal.
With PL Capital Group – Prabhudas Lilladher, trade or invest easily with the PL Capital app. Download the app, and invest in stocks, mutual funds, bonds, IPOs and more!
Strategies to Trade with a Morning Star Candlestick Pattern
Trade volumes of an asset play a crucial role in forming the morning star pattern. With an increasing volume from selling towards buying, this bullish reversal pattern is confirmed on the 3rd day of the 3-day session.
However, you can follow the strategies mentioned below to make potential profit using this pattern:
-
Place a Stop-Loss
When you spot this pattern and trade, protect your investment by placing a stop loss. You must place it at the lowest point of this pattern. As in the earlier example, place your stop loss at INR 420. If the price falls below INR 420 even after rising, it shows that a reversal has failed, helping you limit potential losses.
-
Points of Entry
As you now know, in a morning star pattern, a long bearish candle forms first, followed by a small candle of indecision. You might want to enter a trade when a candle opens next to the third bullish candle.
-
Set Profit Target
To set your potential profit target, you must calculate the distance between the low of its initial candle and the high of its third candle. For example, as the low of the first candle is INR 420 and the high of the third candle is INR 445, making a difference of INR 25. From the breakout, you can project INR 25 upward to set a potential profit target around INR 470.
-
Manage Risks
While trading with the Morningstar candlestick, setting only a stop-loss might not suffice. Set an effective risk-reward ratio for each trade you are making with this pattern. You must try to ensure that potential losses are minimal while increasing profit-making opportunities. You must adjust risk management strategies with changing market conditions.
Mistakes to Avoid with the Morning Star Pattern
Here are 3 key mistakes an investor typically makes when they spot this pattern in a chart. Take a look at this section so that you do not make the same ones:
-
Not Considering the Overall Market Trend
When you spot this pattern and before you make trade decisions, do not ignore the overall market condition. With this pattern, trading a pullback reversal during an uptrend might be better, depending on conditions, rather than facing a downtrend reversal.
-
Wait for the Pattern Completion
Trading early without letting the third candle form completely might be another mistake as a trader. For example, if you enter the trade at INR 425 before the third candle confirms the reversal fully, the price could drop back to INR 420, causing an early loss.
-
Ignoring Other Technical Analysis
It is always wise to confirm a morning star pattern and the potential bullish reversal with other available technical indicators. A sole reliance on the pattern might result in a wrong trading decision.
Conclusion
When trading in the stock market, the morning star pattern might appear after a strong downtrend in the price of an asset. It consists of three separate candlesticks, each representing a strong bearish move at first, a phase of indecision at second and a bullish or upward reversal on the third day.
With PL trade or invest seamlessly in stocks, IPOs, mutual funds, gold bonds and more with the PL Capital app. Download the app today, complete an e-KYC and start investing!
FAQ’s on Morning Star Candle Stick Pattern
1. Is the morning star pattern bullish or bearish?
Typically, when the third candlestick in a morning star pattern completes, it indicates a potential uptrend in asset prices.
2. Which indicators work best with a morning star pattern?
Solely relying on the pattern might lead to wrong investment decisions. Hence, you can consider other indicators like trade volumes, support levels, etc, for the uptrend confirmation.
3. Is the morning star a reversal or continuation pattern?
The morning star candlestick is a potential bullish reversal after a strong downtrend of asset prices.
4. How reliable is the morning star candlestick pattern for traders?
Like every other technical pattern, this one also does not come with 100% accuracy for price movement forecasts. Combine the forecast of the pattern with trade volumes, RSSI signals, support levels, etc, to confirm the movement.
5. How to confirm a morning star candlestick signal?
When the third green candle appears after the second one, and it is close to the halfway point of the first red candle’s body, it typically represents a valid morning star.