What is a Flag Pattern in Intraday Trading?
- 13th November 2025
- 12:30 PM
- 7 min read
A flag pattern is an easy-to-understand candlestick chart pattern for momentum trading. This pattern forms when a stock price is moving upwards or downwards, takes a pause, and then again continues its journey.
Although it looks as simple as a flag, this pattern provides a powerful continuation signal, which allows you to make informed decisions.
Read this blog to understand the entire process of the flag pattern trading, its advantages, disadvantages, and key features.
What is a Flag Pattern in Trading?
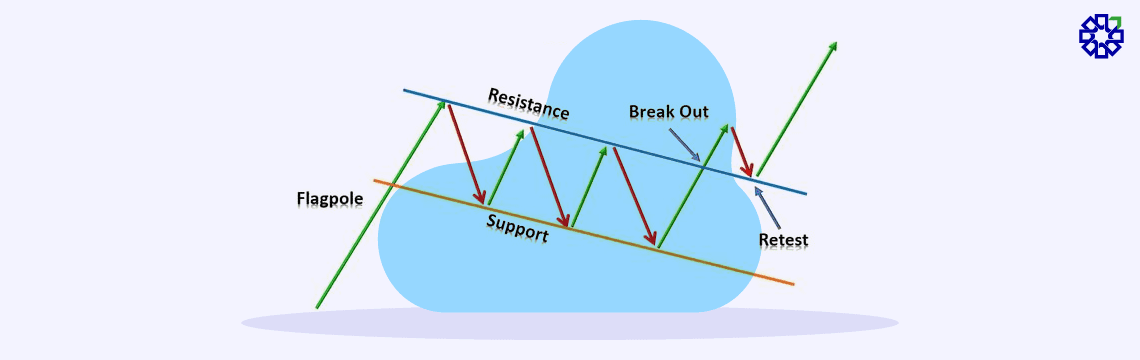
A flag pattern is formed when there is a sharp rise or dip in stock prices, before a limited price range trading. It completes after another sharp rise or fall in the same direction, just like the prior. These are considered short-term patterns that last for more weeks.
This consolidation makes the shape look like a rectangle, just like a flag on a pole. They represent a consolidation period after a strong price movement.
How Does a Flag Pattern Look?
Identifying a flag pattern is easy since it comprises a body and a pole. The body takes the form of a rectangular shape produced by two parallel lines. A rectangular shape is massively attached to the flagpole.
In flag charts, the term ‘pennant’ is also used interchangeably, although there is a slight difference between a pennant and a flag. The middle portion of a flag typically has no trendline convergence, whereas in pennants, it often exhibits converging trendlines.
Importance of a Flag Pattern
A flag pattern is important since it provides valuable insights into market trends. This pattern emerges when there are no significant lows or highs in an asset’s price, and the movement occurs within a narrow range.
They usually appear as a balance between the bull and bear of the market. There is no detectable new trend, and investors are searching for certain price points to determine the financial asset’s support and resistance levels.
You have to wait patiently for a breakout once a flag pattern has developed in the market. When the price level exits the limited range it has been in for some time, this would take place. A prospective new trend in the market is indicated by a breakout over the barrier or support level.
You must also use an alternate trading approach using oscillators like the Relative Strength Index (RSI) and Moving Average Convergence Divergence (MACD). This can help you spot overbought or oversold price levels that might trigger a breakout.
However, it is crucial to remember that not every flag chart pattern leads to a trend reversal. To make wise investment decisions, traders should examine flag patterns with other technical analysis metrics and indicators.
Features of a Flag Pattern
Now that you know what is flag pattern and its importance, have a look at the key features of a flag pattern:
-
Direction
Both uptrends and downtrends can have flags. The flag pattern slopes downward during an increase and slopes upward during a downturn.
-
Volume
Trading volume often declines in the flag phase during the creation of these formations. This suggests a decline in market activity before a possible breakthrough.
-
Symmetry
The pattern’s flag section features parallel lines made up of nearly equal highs and lows.
-
Duration
Patterns on the flag charts are relatively shorter, lasting a few days to a few weeks.
What is a Bull and Bearish Flag?
The bull and bearish flags are the two types of flag pattern, which are explained below:
-
Bull Flag
On candlestick charts, a bull flag is a price movement pattern that emerges after a notable upward surge. Before breaking out over resistance and continuing the first rise, the market consolidates with two parallel lines of support and resistance in a bullish pattern. The pole is the preceding upward movement, and the support and resistance lines create the flag. The price of the market will frequently fall inside the flag.
It denotes a temporary halt to the market’s rising trend. You can see the bullish trend’s continuation after the breakout to the upward from the consolidation period.
-
Bearish Flag
It is just the opposite of a bull flag design. A market gets stuck between support and resistance after a big decline and often starts to trend upward. However, the initial bearish conditions return when a breakthrough beyond the support line takes place. If the lines of resistance and support are identical, the flag of a bearish pattern may be flat or pointing upward.
It signifies a temporary halt to the market’s declining momentum, and the breakout from the consolidation phase to the negative validates the bearish trend’s persistence.
Advantages of a Flag Pattern
The ease of visual identification of a flag pattern is one of its greatest benefits. Even inexperienced traders may easily see them because of their combination of a sharp consolidation channel and a tall flagpole.
Since the breakout frequently restarts the previous trend with considerable strength, they are also popular due to their tremendous continuation potential.
Additionally, flag patterns offer precise technical levels for a trading strategy. While the length of the flagpole provides a rational way to determine price objectives, the flag’s edges serve as natural boundaries for stop losses. This clarity encourages careful trading and lowers uncertainty.
Disadvantages of a Flag Pattern
A flag pattern is not so perfect, despite its appeal. Particularly in low-volume settings or range-bound markets where price lacks conviction, false breakouts are a frequent issue. This implies that instead of jumping into a position at the first indication of movement, traders need to be disciplined and patient while waiting for confirmation.
Furthermore, whereas flagpole-based measured moves provide useful goals, there is no assurance that the price will consistently hit them. The anticipated advance may be disrupted by outside factors like economic news or unforeseen volatility.
Final Thought
A flag pattern can help traders enter or exit trades with more knowledge. For a thorough trading strategy, you should use other indicators and analytical methods, just like any other technical analysis tool. With the right information and application, the flag pattern can be a useful tool for you.
You can also download the PL Capital Group – Prabhudas Lilladher application and open a Demat account for free. PL also provides you with investment recommendations from their experts.
Frequently Asked Questions
1. Can you see flag patterns in both uptrends and downtrends?
Yes, you can see flag patterns in both uptrends and downtrends. A bullish flag forms in an uptrend, and a bearish flag occurs in a downtrend.
2. What is the general price target after a flag pattern breakout?
You have to measure the height of the flagpole to estimate the general price target after a flag pattern breakout. You also need to add that distance to the breakout point.
3. What are the differences between a flag pattern and a pennant pattern?
The primary difference between a flag and a pennant pattern lies in their shape. A flag pattern consists of two trendlines that form a rectangle. Conversely, a pennant pattern has converging trendlines that take the shape of a symmetrical triangle.
4. Can you use a flag pattern in different markets?
Yes, you can use a flag pattern in different markets, including stocks and forex markets. These patterns indicate a possible continuation of an existing trend and are available in both bullish and bearish markets.