What Is Hanging Man Candlestick Pattern?
- 13th November 2025
- 12:30 AM
- 8 min read
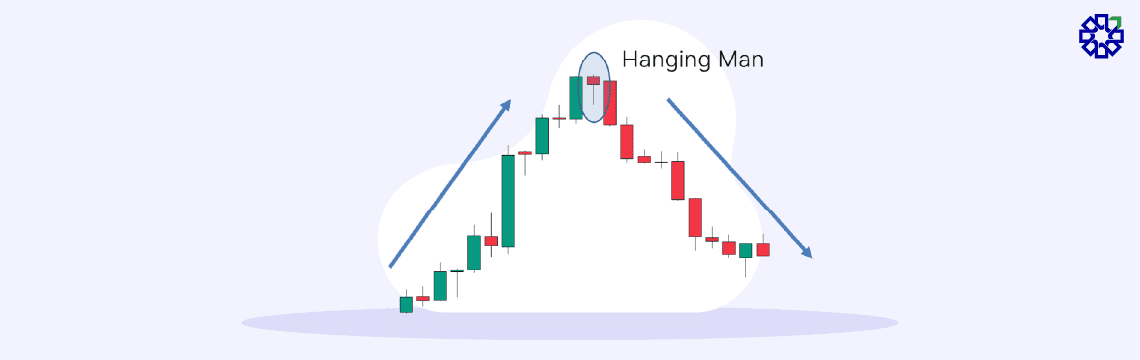
A hanging man pattern appears in a technical chart for trading and usually indicates a probability of a shift in the market trend. Such a shift typically occurs from an uptrend to a downtrend and serves as a warning sign that selling pressure may be on the rise.
About 11.4 crore active investors and traders are in India, and if you are one of them and into trading, learning this pattern might be useful for making informed trade decisions.
A Brief Introduction to Hanging Man Candlestick Pattern
As a trader, when you see an asset price showing an upward movement and after this sustained uptrend, a hanging man pattern might appear. This means that an ongoing bullish momentum is near its end, and a bearish or downtrend is near.
You can spot a hanging man candlestick quite easily from a chart by reading its structure. This candlestick has a small body, typically near the top of a price range. It might have a small upper-shadow or wick at its top, or this wick might not exist at all.
However, it has a longer wick or shadow at the lower part of it. You might also want to look out for its colours for better identification.
When a Hanging Man Candlestick Pattern Appears?
The appearance of a hanging man pattern candlestick depends on a few factors. They include key price points of an asset, such as its opening, closing, lowest and the highest price. To better understand how it appears depending on such price points, let us resort to an example:
Suppose the stock you are observing for days has rallied and gone up from INR 800 to INR 1200. During the session, sellers pushed the price down to INR 1,170, creating a long lower shadow. This forms the small body of the stick.
Now, buyers recover most of the loss, and thus the stock closes near its opening price. This forms a small real body close to the opening level.
This pattern suggests that, despite buyer recovery, selling pressure is emerging, which could signal a potential reversal after the uptrend.
What Does a Hanging Man Candlestick Indicate?
If you are into day trades too, you must know that only about 20% of such traders typically become able to make profits after the trade ends. Therefore, learning the indicators of a hanging man pattern candlestick specifically is important to make trading decisions:
-
Body Formation and Colour
When a hanging man pattern appears on the chart, a trade closes near its opening price, and a small body appears. A white or green body indicates that the closing price has been just above its opening price.
If the colour is either red or black, it indicates that the closing price of the asset on a trading day has been slightly lower than its opening price.
-
Lower Shadow
A lower shadow or a lower wick represents that the seller tried pushing the prices down. However, the prices bounced back on the same trading day.
-
Upper Shadow
Usually, this shadow or wick is non-existent or very small. This indicates that there has been little to no further buying pressure on the same trading day.
Difference Between Hanging Man and Hammer Candlestick
Here are 5 key differences you must learn about between the hanging man and the hammer candlestick as you learn about the hanging man pattern:
| Parameters | Hanging Man Pattern | Hammer Candle Stick |
| Context of the market | It typically appears after a sustained uptrend. For example, a stock rising from INR 800 to INR 1,200 might form a pattern near INR 1,200, hinting at a reversal. | Conversely, this pattern appears post a downtrend. Suppose a stock falls from INR 1,200 to INR 800. It might form the pattern near INR 800, signalling a possible rebound. |
| Actions by the traders | As a trader, you might choose to go short or to sell. | You might want to prepare and buy or hold longer positions. |
| Structure | It appears with a small real body with a longer lower wick and no or very small upper wick. | It appears with a small body at the top. |
| Confirmation | Traders make selling or sorting decisions by confirming the bearish trend with the next bearish candle. | Traders typically wait for the next bullish candle to form. |
| Location on charts | Typically appears at the top or at the resistance level. | Usually appears at the bottom or near the support level. |
With PL Capital Group – Prabhudas Lilladher, you can invest in IPOs, stocks, mutual funds, gold bonds and more easily with the PL Capital app. Download the app today and invest!
Advantages of Hanging Man Candlestick
Here are 2 key advantages that the hanging man pattern candlestick brings to you if you trade accordingly with it:
-
Clear Visibility of Trend
With the small body and a longer wick, traders, including the new one, might clearly locate it. Also, as it signals that buyers are losing power, traders can have the opportunity to prepare for shorting or selling the shares.
-
Versatile Across Assets
You can spot a hanging man pattern across various asset markets that include stocks, indices, e.g. Nifty 50. You might also find it across other asset markets, such as the commodities and daily, hourly or weekly time charts.
Drawbacks of the Hanging Man Pattern
Although the hanging man pattern candlestick helps in locating potential reversals, it has the following drawbacks that you must take care of:
-
Wait for Confirmation
A hanging man pattern might not always be correct or accurate. Hence, you must wait for the next bearish candle to appear or use another bearish signal to confirm the downtrend.
-
Market Context
From the context of the market, this pattern might become meaningful if it appears after a strong uptrend. If it appears randomly in a rough phase of the market, it might not mean much.
What is the Optimal Timeframe to Use the Hanging Man Pattern?
While there is no strict timeframe set for using this chart, you can follow what other traders do. Traders typically use this during daily analysis of charts. You can also apply it across timeframes, such as daily or weekly charts.
However, keep in mind that the shorter the timeframe, the more its reliability decreases due to higher volatility.
Conclusion
If a hanging man pattern appears on the trading chart when there is a sustained upward price movement of an asset, it indicates seller pressure is rising and a downward trend might be near. It appears as a small body with a longer lower wick and a very small or no upper wick.
With PL, you can invest in stocks, IPOs, gold bonds and more using the PL Capital app. Download it, complete an easy e-KYC and start trading today!
FAQ’s on Hanging Man Pattern
1. How do traders confirm the hanging man pattern with other technical indicators?
Traders typically wait for the bearish candle to appear next to the hanging man pattern and make a selling or shorting decision.
2. Can the hanging man pattern form in the forex and stock markets alike?
Yes, the pattern of the hanging man in a technical trading chart can appear across the stock and the forex market.
3. What is the typical price action after a hanging man pattern forms?
When this pattern forms, the price action is typically a bearish reversal. If confirmed, asset prices might decline gradually or start a short-term downtrend.
4. How does the hanging man pattern signal a potential reversal in uptrends?
It signals a potential reversal in uptrends. It shows sellers gaining strength after strong buying. A long lower shadow reflects intraday selling pressure, hinting that bulls may be losing control.