Understanding the Rounding Bottom Pattern in Technical Analysis
- 17th November 2025
- 12:00 AM
- 6 min read
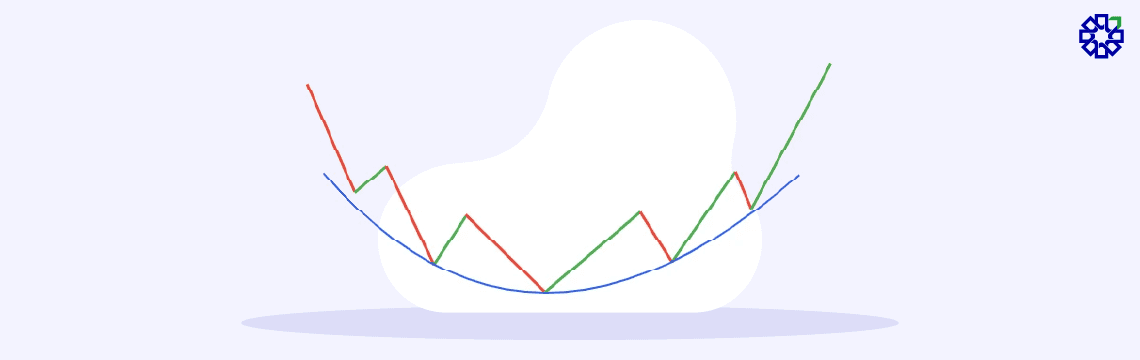
The rounding bottom pattern is one technical analysis tool that appears on trading charts when the downtrend of an asset price is about to end, and there is a potential uptrend nearby. You can locate this pattern on charts as it creates a rounded bottom that takes a ‘U’-like shape. In India, about 11.4 crore people actively participate in the Indian securities market, and if you are one of them, you must learn to read this shape for informed trade decisions.
A Brief Discussion About a Rounding Bottom Pattern
If you are actively trading in the stock market or beginning to learn different chart patterns, a rounding bottom pattern usually forms at the end of a price downtrend.
It signifies that there has been a gradual decline in an asset’s prices, followed by a stabilisation or consolidation period. The pattern completes when there is an uptrend in prices. Typically, this rounding bottom forms over long periods, which might be a few days to a few months.
Let us understand this formation with a simple example. Suppose a stock falls from INR 200 to INR 120. It trades between INR 120 and INR 130 for a few weeks. Then, it gradually rose back to INR 200, creating the rounded bottom.
Once it breaks above INR 200, traders may see it as a rounding bottom breakout. To identify it, traders typically imagine a straight line connecting the highest price points of both sides of the ‘U’. It serves as a resistance level of this pattern.
Although it is a rare formation, market experts suggest it has a typically higher success rate.
A Detailed Working Mechanism of a Rounding Bottom Pattern
After having a basic idea about what is rounding bottom pattern, you must learn the working process of this pattern. It will help to decode this formation more specifically and find it easily on a trading chart:
-
A Fall in Asset Prices
Initially, asset prices start falling at some point. It might continue falling and stay at low prices for some time. Continuing the previous example, a stock’s price falls from INR 200 to INR 120 as bears or sellers maintain the selling pressure for a few weeks.
-
Bottoming
The selling pressure gradually decreases and then stops, leading to its price consolidation or stabilisation. Here, suppose, its price stabilises between INR 120 and INR 130 and creates its ‘U’ shape.
-
Price Reverses Gradually
Now, its price starts going up gradually, i.e. without a sudden or sharp upward movement. In this case, it goes from INR 130 to INR 150 and then INR 170.
-
A Continued Reversal
This gradual reversal continues for some time and thus creates the right side of the ‘U’. Now, if its price reaches INR 200, which was its previous high, you can connect these two highest points and imagine one neckline or resistance line.
-
Breakout
If its price crosses INR 200 and goes beyond its resistance line upwards, traders consider it a bullish breakout confirmation.
If you want to participate in intraday trading, the PL Capital Group – Prabhudas Lilladher is the perfect solution as it helps you invest and trade in stocks, mutual funds and more. Download the app, complete an e-KYC and invest today!
How to Trade the Rounded Bottom Pattern?
Once you locate this pattern, you need a strategy to increase your return potential from trades using it. First, you might want to enter a long position once this pattern completes and enters an uptrend. Referring to the earlier example, you might enter a trade at INR 205.
Do not forget to place a stop-loss. Place it just below the lowest price point of this pattern.
Also, set a profit target post-measuring its depth. In this case, the depth is INR 80 (INR 200 – INR 120) and the target is INR 280.
Benefits of Trading the Rounding Bottom Pattern
Here are a few key benefits you must learn about this pattern:
-
Information for Trade Decisions
A rounded bottom pattern provides clear information about opening, closing, highest and lowest price points of an asset. Thus, it becomes easier to interpret and make decisions.
-
Entry and Exit Times
It also helps set a proper time to enter a long position and exit once a potential profit is made.
Disadvantages of the Rounding Bottom Pattern
Here are some disadvantages of it that you must be careful about:
-
False Signal
A rounding bottom pattern might generate false signals. It means that prices might reverse downward instead of going up the trendline, trapping early entrants.
-
Longer Formation Time
As it takes days to weeks to form and complete, traders might face delays in grabbing other trading opportunities while waiting for it.
Conclusion
A rounding bottom pattern usually forms when asset prices decrease, consolidate, rise and go up further. Although it is a rare formation, it indicates a bullish reversal and increased potential for traders looking to enter long positions.
With PL, you can invest in stocks, mutual funds, gold bonds and more, all with the PL Capital app. Download it for more details.
FAQs on Rounding Bottom Pattern in Trades
1. Is a rounded bottom pattern on a technical chart bullish?
Yes, a rounding bottom pattern is a bullish indicator of price trends of assets. It typically appears after a long downtrend. Being a bullish reversal pattern, it typically indicates a transition from bearish or seller control towards a bullish or buyer control.
2. How to identify a rounding bottom pattern on a chart?
A rounding bottom pattern typically appears on a trading chart by creating a ‘U’ shaped form. Within this shape, the prices of a certain asset gradually decrease. It then slowly increases and completes the shape.
3. Is the rounding bottom pattern most profitable?
Although there is no assurance of it being profitable all the time, it typically indicates a significant price increase. As a trader, combining its forecast with trading volume and other indicators might be effective for making profits.
4. Which stock pattern has the highest accuracy?
Typically, research shows that a rounding bottom pattern, a Double Bottom, a Head and Shoulders pattern, etc, are typically reliable with a potentially higher success rate.